
Which diagram fits your lesson?
Many ways to make meaning.
Answer two quick questions and get the diagram type that fits what you're teaching, with five steps to map it yourself. Free, no sign-up.
Already have your diagram? Free alt text templatesWhat does your lesson need to explain?
Which sounds most like your steps?
Which sounds most like the parts?
Which sounds most like it?
Start overLinear process flow
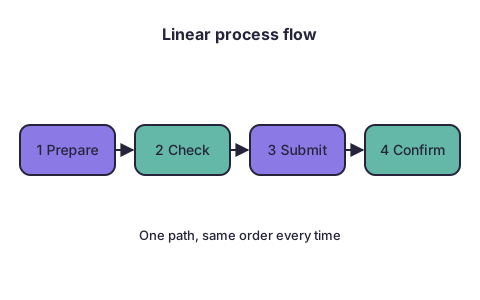
Use it when
the task has one path and the order matters.
Map it in five steps
- Write the goal the learner reaches at the end.
- List every step as a verb plus an object ("Check the form").
- Merge steps that always happen together; aim for 7 or fewer boxes.
- Put them left to right or top to bottom, one arrow between each.
- Number the boxes so the diagram can be referred to in the lesson.
Watch out for
hidden choices. If a step says "if", you need a decision flowchart.
Want it drawn for your topic?
Imagine Visual makes one custom SVG diagram around your topic. Write to us with your steps or parts and the diagram type above, and we'll reply with what we need and when it can be ready.
Decision flowchart
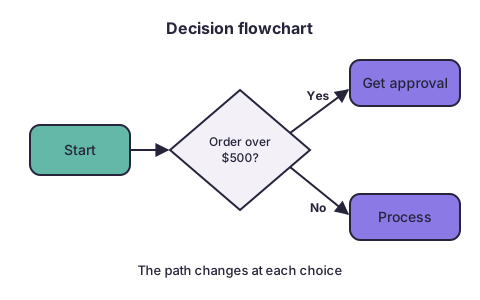
Use it when
what the learner does next depends on a yes/no question or a condition.
Map it in five steps
- Write the start and every possible end.
- Find each point where the learner must decide; phrase it as a yes/no question.
- Draw each question as a diamond with exactly two labeled exits.
- Follow every branch to an end; no branch should stop in the air.
- Walk through it with one real case for each branch.
Watch out for
more than about five decisions on one page. Split it into two charts.
Want it drawn for your topic?
Imagine Visual makes one custom SVG diagram around your topic. Write to us with your steps or parts and the diagram type above, and we'll reply with what we need and when it can be ready.
Swimlane diagram
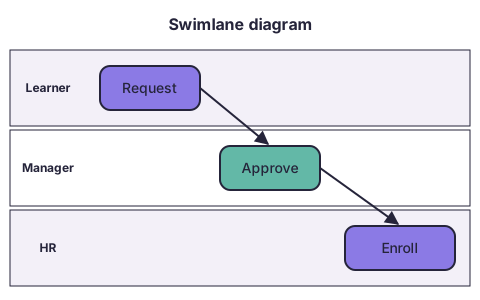
Use it when
a process moves between people, roles or teams, and who does what matters.
Map it in five steps
- List the roles; each gets one lane (a row or column).
- List the steps in order, as in a linear flow.
- Put each step in the lane of the role that does it.
- Draw the arrows; every arrow that crosses a lane is a handoff.
- Check each handoff: does the next role know the work has arrived?
Watch out for
lanes for roles that do only one step. Fold them into a note.
Want it drawn for your topic?
Imagine Visual makes one custom SVG diagram around your topic. Write to us with your steps or parts and the diagram type above, and we'll reply with what we need and when it can be ready.
Cycle diagram
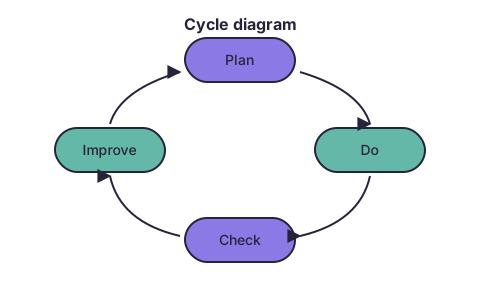
Use it when
the stages repeat, and the end leads back to the beginning.
Map it in five steps
- Name the stages, 3 to 6 of them.
- Choose the stage the learner starts at and put it at the top.
- Place the rest clockwise, evenly around a circle.
- Draw one arrow from each stage to the next, and from the last back to the first.
- Add one line under each stage saying what happens there.
Watch out for
a stage that does not really return. If the process ends, use a linear flow or a timeline.
Want it drawn for your topic?
Imagine Visual makes one custom SVG diagram around your topic. Write to us with your steps or parts and the diagram type above, and we'll reply with what we need and when it can be ready.
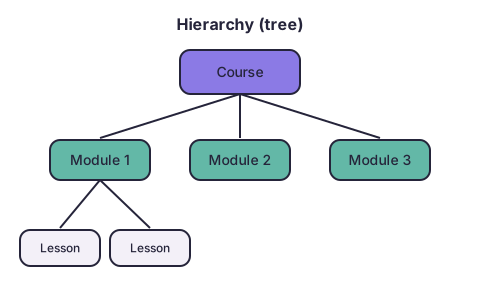
Hierarchy (tree)
Use it when
things sit at levels, and each one belongs to exactly one parent.
Map it in five steps
- Put the whole thing at the top.
- Split it into its main parts; keep to 2 to 7 per level.
- Split each part again only as far as the lesson needs.
- Make every box on one level the same kind of thing.
- Read each line aloud as "X contains Y" or "X manages Y" to check it.
Watch out for
something with two parents. That is a network; use a concept map.
Want it drawn for your topic?
Imagine Visual makes one custom SVG diagram around your topic. Write to us with your steps or parts and the diagram type above, and we'll reply with what we need and when it can be ready.
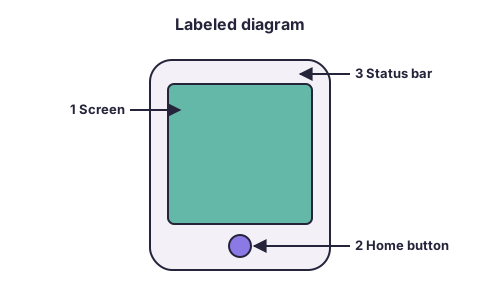
Labeled diagram
Use it when
learners must recognize and name the parts of one object, screen or tool.
Map it in five steps
- Start from a clean drawing or screenshot of the thing.
- Choose only the parts the lesson teaches; leave the rest unlabeled.
- Number the labels in the order you will teach them.
- Draw a straight leader line from each label to its part, without crossings.
- Keep the labels outside the picture, lined up on one or two sides.
Watch out for
more than about ten labels. Zoom into part of it in a second diagram.
Want it drawn for your topic?
Imagine Visual makes one custom SVG diagram around your topic. Write to us with your steps or parts and the diagram type above, and we'll reply with what we need and when it can be ready.
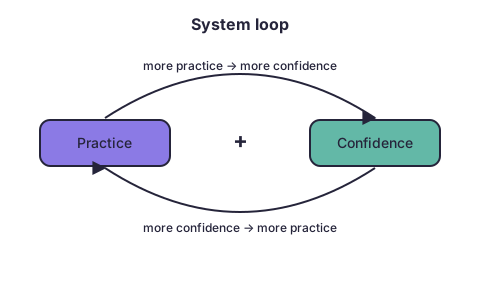
System loop (causal loop)
Use it when
factors push each other up or down, and the effect comes back round.
Map it in five steps
- Name each factor as something that can go up or down ("confidence", not "lack of").
- Draw an arrow from each cause to each effect.
- Mark each arrow + (they move the same way) or − (they move opposite ways).
- Find the closed loops and say in one sentence what each one does.
- Mark where the learner, or the organization, can step in.
Watch out for
arrows you cannot explain in one sentence. Leave them out.
Want it drawn for your topic?
Imagine Visual makes one custom SVG diagram around your topic. Write to us with your steps or parts and the diagram type above, and we'll reply with what we need and when it can be ready.
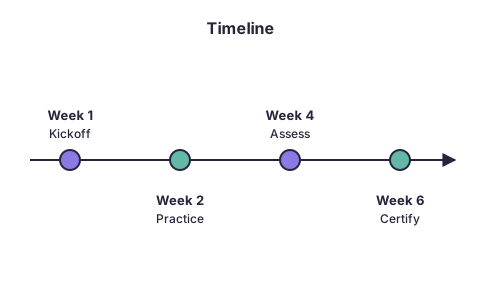
Timeline
Use it when
order and timing matter, such as a schedule, history or rollout.
Map it in five steps
- Choose the start, the end and the unit (days, weeks, years).
- Place the events at their real distances along the line.
- Give each event a date and a two-to-four-word label.
- Group events into phases with a shaded band if there are many.
- Mark "now" if the learner needs to know where they stand.
Watch out for
equal spacing for unequal gaps. It misleads about time.
Want it drawn for your topic?
Imagine Visual makes one custom SVG diagram around your topic. Write to us with your steps or parts and the diagram type above, and we'll reply with what we need and when it can be ready.
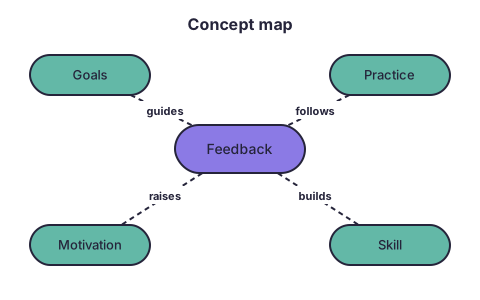
Concept map
Use it when
the lesson is about how ideas relate, not about an order of steps.
Map it in five steps
- Put the central idea in the middle.
- List the 5 to 10 ideas that matter most around it.
- Draw a line for each real relationship.
- Write a verb on every line, so each link reads as a sentence ("Feedback builds skill").
- Remove any idea that has no labeled link.
Watch out for
unlabeled lines. Without the word on the link, the map does not teach.
Want it drawn for your topic?
Imagine Visual makes one custom SVG diagram around your topic. Write to us with your steps or parts and the diagram type above, and we'll reply with what we need and when it can be ready.